Peers
The Peers feature displays the live and historical connection data between devices. The Peers section provides a visual and statistical overview of the connection status between CE device and its associated peer devices, such as PE links and other Spoke devices.
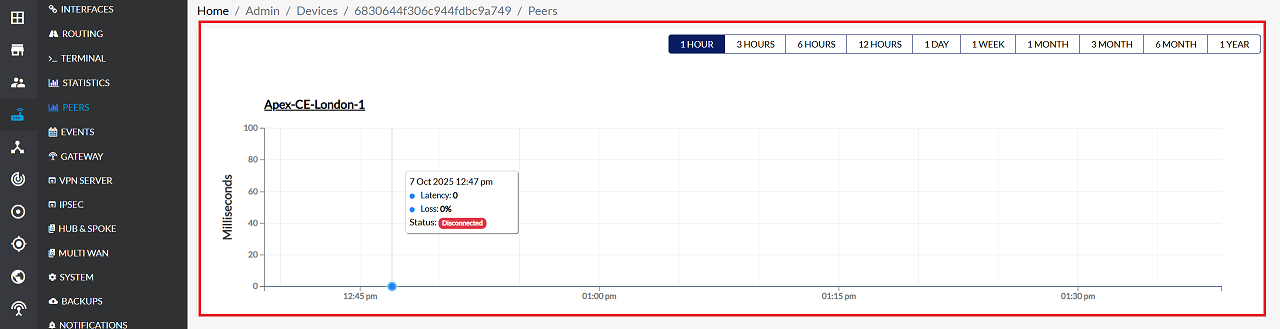
It helps administrators quickly identify when connections were established or disconnected and provides network performance information such as latency (in milliseconds) and packet loss (in percentage).
Each data point on the graph indicates:
- Date and Time of the connection event
- Latency: Network delay measured in milliseconds
- Loss: Packet loss percentage
- Status: Connection state (Connected or Disconnected)
The connection status is color-coded for quick identification:
- Connected: Indicates an active and healthy connection
- Disconnected: Indicates that the peer connection is down
Accesing Peers
Follow the steps below to access the Peers module
- Go to the Login > CE device > Select CE device > Peers.
This opens the peer monitoring graph for the selected CE device.
Time Range Analysis
The Peers page includes multiple time range filters on the top-right side of the graph. Peer connection history can be viewed based on the selected duration. Available time range options include: 1 Hour, 3 Hours, 6 Hours, 12 Hours, 1 Day, 1 Week, 1 Month, 3 Months, 6 Months, 1 Year.
- For example:- If 1 Hour is selected, the graph displays all connection activities that occurred within the last hour.
Graph Interpretation
The graph provides a clear timeline view of peer connection events.
- X-axis: Represents Time (Date and Time)
- Y-axis: Represents Latency (Milliseconds)
Each plotted point shows:
- Device Name
- Latency (in ms)
- Loss (in %)
- Status (Connected/Disconnected)
When the cursor hovers over a data point, a tooltip appears showing these details.
-
As shown in the reference image: For the device “Apex-CE-London-1”, the details include:
- Latency: 0 ms
- Loss: 0%
- Status: Disconnected (displayed with a red background)