Statistics
The Statistics Module provides administrators with a powerful, centralized view for real-time and historical monitoring of device performance.
This module is a critical tool for maintaining device health and network efficiency by tracking key metrics:
- Device Availability: Current Online/Offline status and detailed event logs.
- System Resources: Utilization of CPU and RAM.
- Network Traffic: Throughput across multiple interfaces (WAN, LAN, PPPoE, Wireless Modem).
- Data Trends: Customizable historical views ranging from 1 hour to 1 year.
This overview provides a summary of the statistics being used by the device, such as details about the interfaces and other relevant metrics.
Accessing the Statistics Module
To retrieve and view the device statistics, follow these steps:
-
Login to the main platform.
-
Navigate to the CE Device section.
-
Select the required device from the list.
-
Click on the Statistics tab or button associated with the selected device.
-
Choose the desired Time Range for the data visualization:
- Short-Term: 1 Hour, 3 Hours, 6 Hours, 12 Hours.
- Long-Term: 1 Day, 1 Week, 1 Month, 3 Months, 6 Months, 1 Year.

Step-by-Step Module Explanation
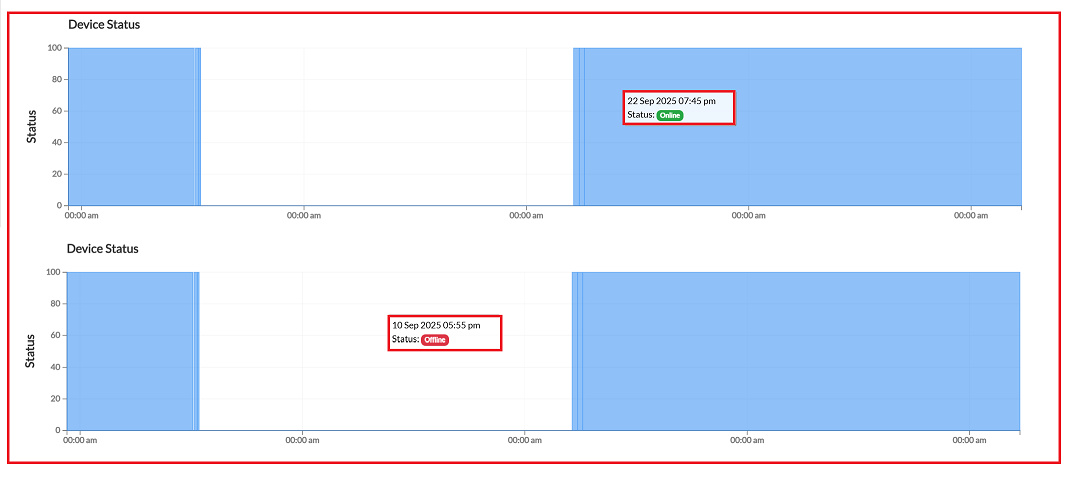
Device Status
This graph provides a basic view of the device's operational status over a selected time range:
- It clearly shows the online/offline, date and time status of the device.
- Green status indicates periods of uptime (device online).
- Red status highlights offline events (device offline).
Hovering over any point on the graph displays the exact timestamp and status of the device at that moment.
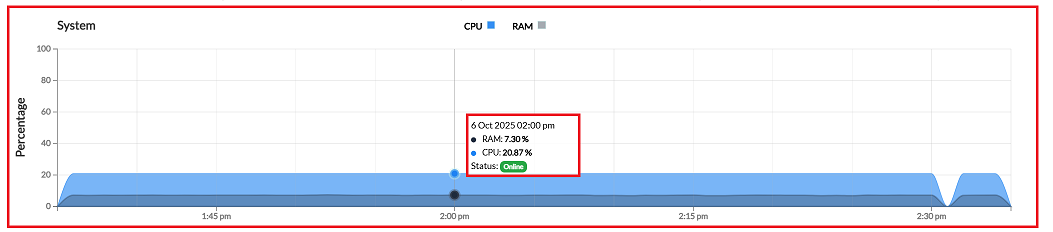
System Performance
The System section is crucial for analyzing the internal load and preventing resource over-utilization:
-
CPU Usage (%) is displayed, typically represented by a Blue area.
-
RAM Usage (%) is displayed, typically represented by a Grey area. This visualization helps in analyzing load trends to ensure system stability and optimize configurations.
Network Interfaces
This section details traffic throughput across all monitored network interfaces. For each interface, the graph monitors Tx (Transmit) and Rx (Receive) traffic, providing Min, Max, Average, and Total Data transferred during the period.
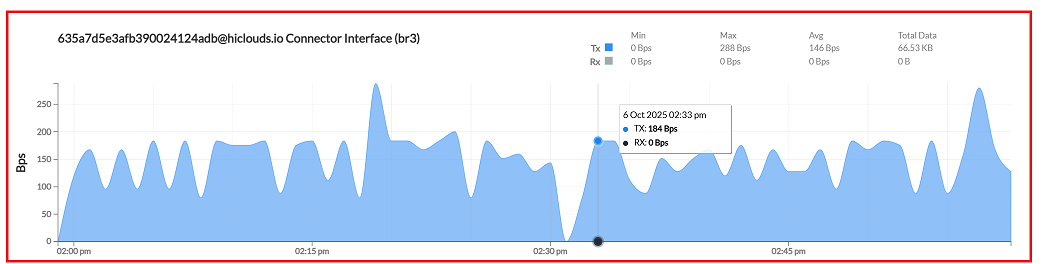
Connector Interface (br3)
-
Monitors traffic for the internal bridge interface (br3).
-
Values are displayed in Bps (Bits per second).
-
In addition, the TX and RX statistics (Min, Max, Avg, and Total Data) are displayed in the top-right corner, and the graph shows TX and RX values along with date and time.
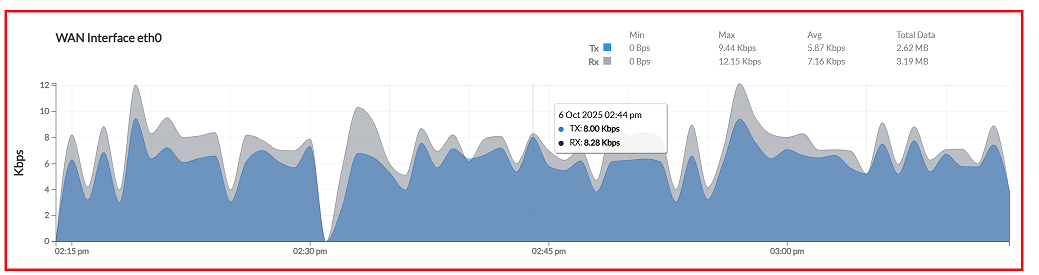
WAN interface (eth0)
-
Tracks external internet usage and overall network connectivity.
-
Values are displayed in Kbps.
-
Shows key metrics for upload and download speeds, along with total transferred data.
-
Additionally, TX and RX statistics (minimum, maximum, average, and total data) are displayed in the top-right corner, and the graph shows TX and RX values in kbps along with the date and time.
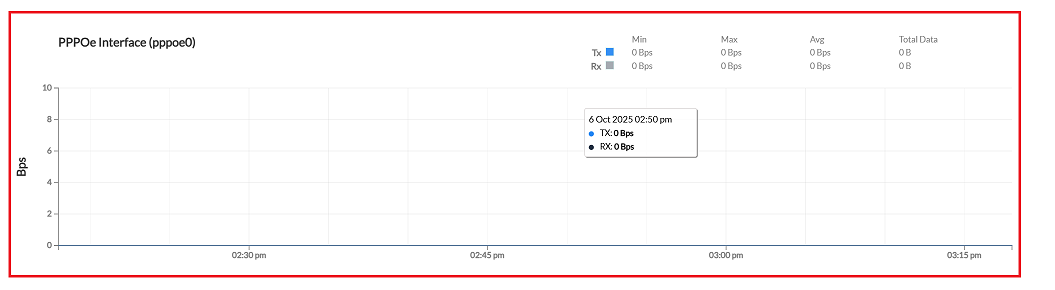
PPPoE Interface (pppoe0)
-
Monitors traffic specifically routed through the PPPoE tunnel.
-
Displays Tx/Rx bandwidth, average, and total data for the tunnel.
-
If the PPPoE connection is inactive or unused, the traffic will remain at 0 Bps.
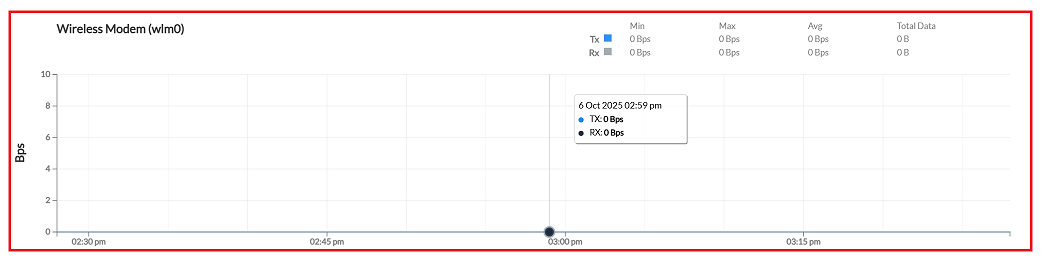
Wireless Modem (wlm0)
This section monitors traffic for the wireless modem interface.
-
Values are currently displayed as 0 Bps (Bits per second), indicating low or no current usage.
-
The graph shows Tx (Transmit) and Rx (Receive) values along with the date and time.
-
The top-right corner displays the Tx and Rx statistics, including Min, Max, Avg, and Total Data transferred.